Structured illumination for cross-correlative refractive-index and fluorescent super-resolution
My previous projects up till now had demonstrated that structured illumination (SI) microscopy could be applied for coherent super-resolution, with specific demonstrations targeting super-resolution of quantitative-phase (QP) and coherent scattering. For this project, I wanted to target super-resolution of 3D biological refractive-index (RI). Since RI is the intrinsic parameter giving rise to all optical properties of an object (including QP and scattering), I figured that this was the natural step forwards from my previous works.
Furthermore, RI has established applications towards measuring endogenous biophysical and biochemical properties, and is useful for measurements of cellular mass, shear force, spectroscopy, etc. This set of information is directly complementary and orthogonal to that provided by fluorescence imaging, which focuses on molecular specificity and is hugely important for visualization of individual organelles, protein interaction, gene expression, etc. At the time of this project, there weren't any imaging systems that allowed both cellular RI and fluorescence to be visualized at the same time, which I always thought was truly unfortunate for biological research. I mean, how useful would it be to be able to correlate endogenous cellular characteristics with molecular-specific intracellular components? Incredibly useful, I'm betting!
question for this project: Can we develop an imaging system to allow cross-correlative refractive-index and fluorescent visualization at super-resolutions?
Our solution...
Let's use structured illumination microscopy! Based on my previous works, I had convinced myself that it can be used for 3D imaging with both fluorescent AND non-fluorescent contrast. So why not use it here?
Methods...
Structured illumination (SI) microscopy is already well-established for 3D fluorescent super-resolution, courtesy of a host of works from the Gustaffson group. The trick was figuring out how to adapt SI for 3D RI imaging. Thankfully, there is a large body of works for optical diffraction tomography (ODT) that focuses on reconstructing 3D cellular RI from illuminating an object at varying angles. Though ODT and SI have different origin stories, the trick is realizing that SI, when operated in non-fluorescent mode, is mathematically equivalent to a multiplexed version of ODT! Thus, by decomposing a SI dataset into a sequence of ODT-equivalent acquisitions, we can leverage conventional ODT processing to reconstruct 3D RI.
To give a general description of this phenomenon without getting too bogged down in details, we show below two Figures. The left-side Figure mainly demonstrates that a sinusoidal structured pattern can be created with the coherent interference of three illumination beams. In this case, the region of measured k-space of the object is the mathematical aggregate of what would have been measured if each component illumination beam was used individually. That means that 3D k-space can be measured in the same way as conventional ODT by simply illuminating the sample with sinusoidal patterns of varying spatial periods, as shown in the right-side Figure. Pretty cool!
|
Equivalence of SI and multiplexed ODT
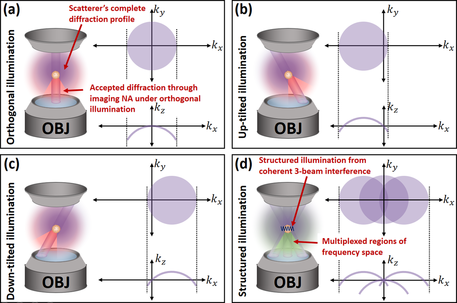
Illumination/detection schemes and corresponding 3D regions of object spatial frequencies imaged at the detector are shown for (a) orthogonal, [(b), (c)] tilted, and (d) SI. Note the subsection of the object’s diffraction, which passes through the system aperture under orthogonal illumination [shown in red in (a)] tilts based on illumination angle.
|
SI can fill out k-space equivalently to ODT
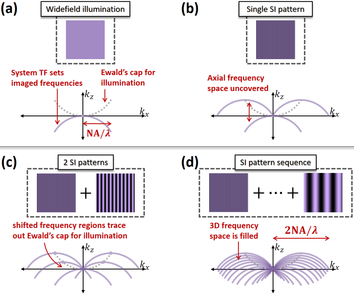
Illustrating the concept of SI-enabled DT. (a) Widefield coherent imaging samples a spherical shell of an object’s spectrum. (b) SI allows sampling of pairs of shells from regions of the object’s spectrum. (c) As the spatial frequency of the SI changes, the regions of imaged content trace Ewald’s sphere of possible illumination wavevectors. (d) With sufficiently small increments of SI spatial frequency, the 3D region of object’s frequency space is filled.
|
Results
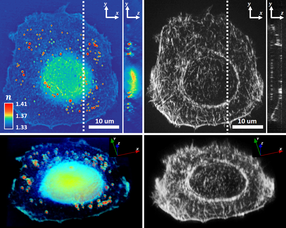
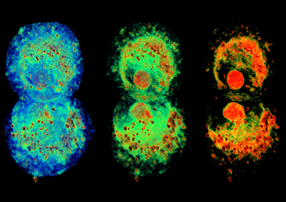
Needless to say, it works! And quite beautifully too! Below, I show an example below of a cluster of three joined HT-29 human colorectal cells visualized in 3D with both endogenous RI contrast and fluorescence (for tagged F-actin), using the same optical system. Pretty amazing visualization! With RI contrast, you can see the nucleoli, nucleus, vesicles, etc, which have markedly prominent RI features compared to the general cytoplasm. But also importantly, the fluorescent visualization allows a drastically different visualization of the same sample that can be correlated and registered to the RI visualization to allow a synergistic analysis of molecular-specific RI, if need be. Because the fluorescent visualization is reconstructed from 3D SI super-resolution, structures are clearly resolved in 3D (as opposed to what happens in conventional fluorescent super-resolution, where there is a blurring-out artifact in 3D). In this case, we can clearly resolve the F-actin, as a molecular component of the cell's cytoskeleton, encapsulating the perimeter of the cell in 3D. It is thus a simple matter to ascertain the locations of the RI-visualized structures with relation to the F-actin, and vice-versa. It is easy to imagine the possibilities if we started fluorescently tagging other intracellular components ...
Needless to say, it works! And quite beautifully too! Below, I show an example below of a cluster of three joined HT-29 human colorectal cells visualized in 3D with both endogenous RI contrast and fluorescence (for tagged F-actin), using the same optical system. Pretty amazing visualization! With RI contrast, you can see the nucleoli, nucleus, vesicles, etc, which have markedly prominent RI features compared to the general cytoplasm. But also importantly, the fluorescent visualization allows a drastically different visualization of the same sample that can be correlated and registered to the RI visualization to allow a synergistic analysis of molecular-specific RI, if need be. Because the fluorescent visualization is reconstructed from 3D SI super-resolution, structures are clearly resolved in 3D (as opposed to what happens in conventional fluorescent super-resolution, where there is a blurring-out artifact in 3D). In this case, we can clearly resolve the F-actin, as a molecular component of the cell's cytoskeleton, encapsulating the perimeter of the cell in 3D. It is thus a simple matter to ascertain the locations of the RI-visualized structures with relation to the F-actin, and vice-versa. It is easy to imagine the possibilities if we started fluorescently tagging other intracellular components ...
|
3D RI/fluorescent visualization of conjoined trio of HT-29 cells
|
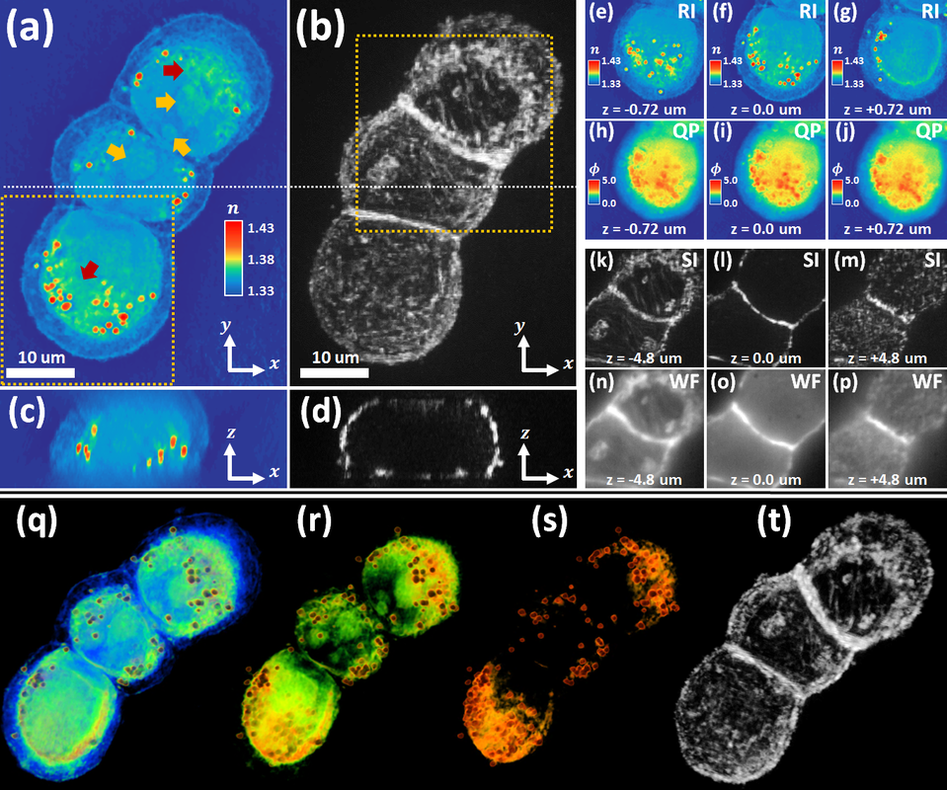
(a) RI slice and (b) fluorescence maximum intensity projection shown for a HT-29 cell cluster, along with (c,d) associated axial cross-sections, respectively. Red and yellow arrows in (a) indicate nuclear periphery and nucleoli boundaries, respectively. From the coherent arm of the optical system, (e-g) RI and (h-j) standard QP visualization is compared for the cell cluster at select axial positions. Similarly, for the fluorescent arm of the system, fluorescent (k-m) super-resolution and (n-p) diffraction-limited widefield visualization of the cell cluster is also compared. 3D Tomograms are visualized with (q-s) different RI-thresholded opacity constraints (to visualize different intracellular components of varying RI) as well as with (t) general super-resolved fluorescent contrast.
Project publications